Demographic Profile
Introduction
Located approximately fifty miles south of Washington, D.C. and sixty miles north of Richmond, VA, Riverbend High School is where I completed my student internship and it is situated within the chiefly suburban county of Spotsylvania, Virginia. Spotsylvania County has over 125,000 residents and its school system caters to a large and diverse group of students (United States Census Bureau [USCB], 2013). Despite being predominantly a suburban county, Spotsylvania does contain both some rural areas and a few more densely populated areas, so the student body at Riverbend comes from a fairly diverse mixture of areas.
Catering to ninth through twelfth grade students, Riverbend has a wide variety of classes to serve the needs of its student population. For this internship experience, I was placed in a geography classroom which provided ninth grade World Geography, Advanced Placement Human Geography (which was open to all grade levels, but primarily contained ninth graders), and a directed study-hall. During this experience, I had the pleasure of teaching both Geography preparations and leading the directed study-hall. Riverbend High School (RHS) uses block scheduling and divides its schedule into A days and B days with four instructional blocks on each day. Of the seven classes I worked with, I will be focusing on a ninth grade World Geography class for the impact study.
The School and School System
With over thirty-three schools, including seventeen elementary schools, seven middle schools, and five high schools plus a career and technical center, two special academies, and the John J. Wright Educational and Cultural Center, the Spotsylvania County School System has a wide range of facilities to meet the needs of its growing population (Spotsylvania County Public Schools [SCPS], 2014). Currently (for the 2013-2014 school year) the Spotsylvania County Public School System (SCPS) serves over 24,000 students spread out across their pre-kindergarten programs through the twelfth grade. With the population of Spotsylvania growing at about 2.7% a year (which is faster than the national average growth rate), SCPS’s student enrollment grows year to year reflecting the overall population growth of the county (USCB, 2013). Within Riverbend High School (RHS), there are 1,921 students enrolled for the 2013-2014 school year and this school has experienced growth (with a one year exception), much like the wider school system, since its founding. The following chart and bar graph illustrates a breakdown of the student populations of both the school system and the school by gender:


Showing the racial diversity of both the Spotsylvania School System and Riverbend High School, the following chart and pie-charts breaks down the student populations by ethnicity:


Spotsylvania County Public School System spends $9,950 per student and has an overall operating budget of $255 million. Additionally, 32% of all Spotsylvania County students are enrolled in the free lunch program whereas only 12% of the student population at RHS qualifies for the free-lunch program (National Center for Education Statistics [NCES], 2013; SCPS, 2014).
Examining the teaching staff at both SCPS and RHS, there was not a lot of specific demographic information available. According to Spotsylvania County Public Schools, there are currently 1, 713 teachers employed by SCPS and 99.2% of those teachers are “highly qualified” using the No Child Left Behind regulation descriptions. According to the National Center for Education Statistics (NCES), RHS currently employs 106 classroom teachers and 99.1% of those teachers are considered “highly qualified” by the federal standards. Unfortunately, information regarding teacher gender, ethnicity, and the average length of time teachers have been in the classroom from both SCPS and RHS were not available.
The Classroom
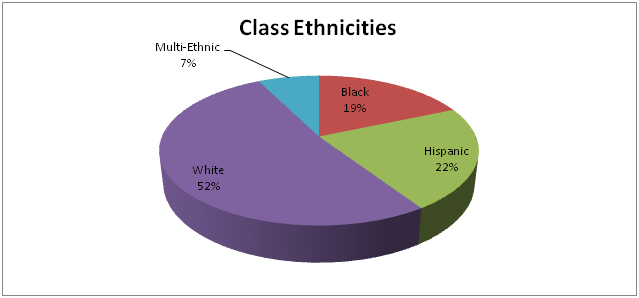
The twenty-seven students in my ninth-grade World Geography classroom reflect a greater ethnic diversity than the larger statistics of RHS and SCPS suggest and brought with them a unique set of skills, abilities, and experiences. Within the A4 World Geography classroom, there was a disproportionately high male to female ratio; there were 16 males in this class and only 11 females. Looking at the ethnic backgrounds of my students, the students presented three major ethnic groups and there were some students whose background reflected a mix of ethnicities. The following chart and pie-chart illustrate the ethnic diversity of my A4 classroom:
Examining the teaching staff at both SCPS and RHS, there was not a lot of specific demographic information available. According to Spotsylvania County Public Schools, there are currently 1, 713 teachers employed by SCPS and 99.2% of those teachers are “highly qualified” using the No Child Left Behind regulation descriptions. According to the National Center for Education Statistics (NCES), RHS currently employs 106 classroom teachers and 99.1% of those teachers are considered “highly qualified” by the federal standards. Unfortunately, information regarding teacher gender, ethnicity, and the average length of time teachers have been in the classroom from both SCPS and RHS were not available.
The Classroom
The twenty-seven students in my ninth-grade World Geography classroom reflect a greater ethnic diversity than the larger statistics of RHS and SCPS suggest and brought with them a unique set of skills, abilities, and experiences. Within the A4 World Geography classroom, there was a disproportionately high male to female ratio; there were 16 males in this class and only 11 females. Looking at the ethnic backgrounds of my students, the students presented three major ethnic groups and there were some students whose background reflected a mix of ethnicities. The following chart and pie-chart illustrate the ethnic diversity of my A4 classroom:

Regarding the special populations within my ninth grade World Geography class, no students had IEPs in place (students with IEPs are in an inclusion Geography classroom or within the special education resource classes depending on the level of student needs), however two students did have 504 plans. The students with 504 plans required special accommodations in class; some of the accommodations included preferential seating, greater latitude with assignment due dates, and receiving typed copies of class notes. Additionally, within the class there were four students with lower level lexile scores and five students who were in advanced level classes. While these students did not have any spelled out accommodations, classroom instruction had to be differentiated with the needs of these diverse groups in mind.
Reflection
Being a culturally responsive teacher and an effective educator in the twenty-first century demands a thorough knowledge of the students you are trying to reach. Researching the demographic details of the school district, the school and the individual classroom helps to provide some of the picture of what will be contributing to your classroom environment (not the entire picture, because individuals are more complex than a collection of facts on a page and there are several other factors added to the mix of a classroom environment). From my own experiences, I would say that one of the greatest challenges facing teachers in today’s diverse learning environments is developing lesson plans that relate to students backgrounds and meet the varied needs of our diverse student populations. This challenge becomes even greater in very diverse classrooms as the background knowledge and experiences of the students are much more varied.
From the demographic details, I collected creating this demographic profile, I feel I was better able reach my students because I was more aware of student needs and the background makeup of my classroom. For instance, to be a more culturally responsive teacher, one of the major class projects I designed allowed students to research and celebrate their heritage (while simultaneously incorporating most of the themes of Geography). Additionally, knowing about the spectrum of needs in my student population informed my differentiation strategies for the class. While differentiation was still challenging, being better informed ensured that I was better prepared.
References
Riverbend High School. (2014). Riverbend High. Retrieved from: http://www.spotsylvania.k12.va.us/riverbend
Spotsylvania County Public Schools. (2014). Division Profile. Retrieved from: www.spotsylvania.k12.va.us
U.S. Department of Commerce, United States Census Bureau. (2012). State and county QuickFacts [Online database]. Retrieved from http://quickfacts.census. gov/qfd/index.html
U.S. Department of Education, National Center for Education Statistics. (2013). School district demographics system [Demographic Map]. Retrieved from http://nces.ed.gov/
